~ InsightEdge
Our Showcase
~ Our Showcase
Product Analytics: Market Basket Analysis [Grocery Shop]
Market Basket Analysis is a data analytics technique that the we can use to identify the purchasing behavior of your customers. It helps to identify associations between different products that customers tend to buy together. The technique uncovers patterns in transactions and determine how products are related, allowing the you to optimize product placement (which products need to be placed in close proximity), identify products to promote through discounts, cross-selling, and customer experience enhancement.
Market Basket Analysis metrics include: Support: The proportion of transactions/ invoices/ trolleys in the dataset in which a particular set of product appears. It indicates how frequently a set of product occurs in different baskets/trolleys. Confidence: The likelihood that one item is bought when another item is bought. Lift: A factor which indicates if 2 products are more likely to be bought together than by chance.

~ Our Showcase
Sales Analytics: Retail Sales Dashboard [Hardware Shop]
Sales analytics involves collecting, analyzing, and interpreting data related to sales performance. It gives businesses a clearer picture of what’s working, what’s not, and where opportunities lie – all in real time. Our solutions help clients understand sales beyond how many products / services are selling.

~ Our Showcase
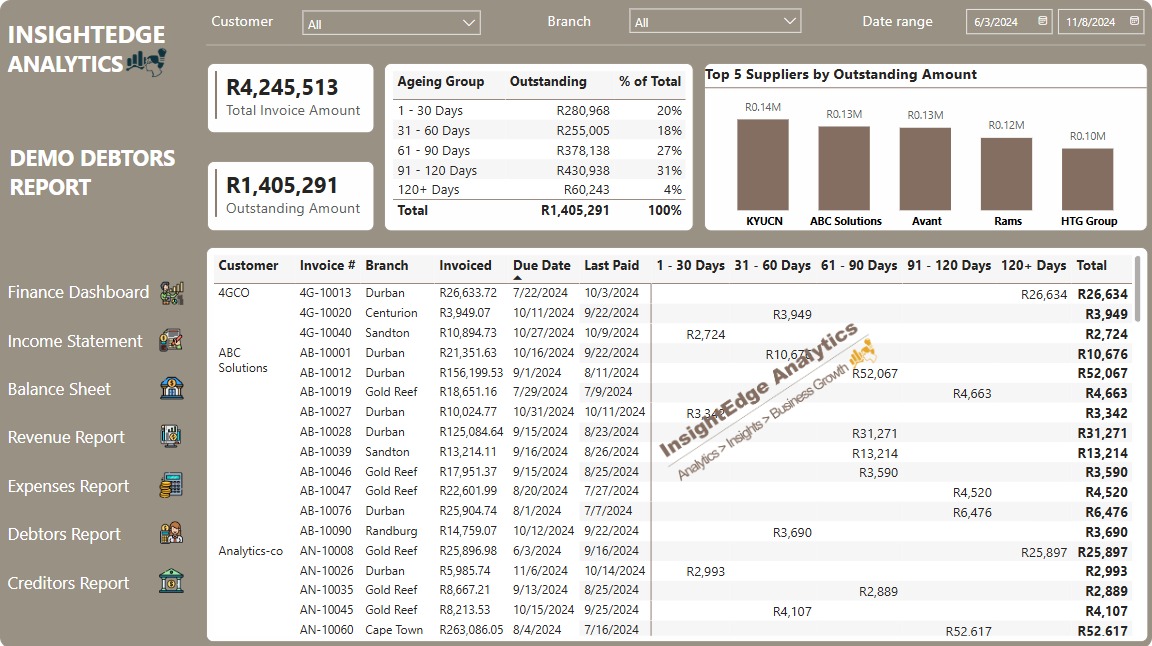
Financial Analytics: Debtors Ageing
Using interactive BI reports transforms debtor ageing analysis from a manual, time-consuming task into an actionable, data-driven process that empowers businesses to improve their financial health, reduce risk, and make smarter, more strategic decisions.
BI tools allow users to filter and explore the debtors ageing report deeper, than when using standard system generated excel reports.

~ Our Showcase
Product Analytics
Product analytics help in pricing, promotions, marketing and shelving decisions. It also guides procurement decisions, helps reduce cost, reduce stock outs and increase customer experience. Our product analytics solutions will showcase inventory levels, inventory turnover, fast or slow selling products, products running out of stock with automated alerts on products needing reorder, most profitable products, RFM analysis (categorizes products by recency of purchase, frequency of purchase and sales value), product correlations, product demand forecasts, time intelligence analytics etc.
~ Our Showcase
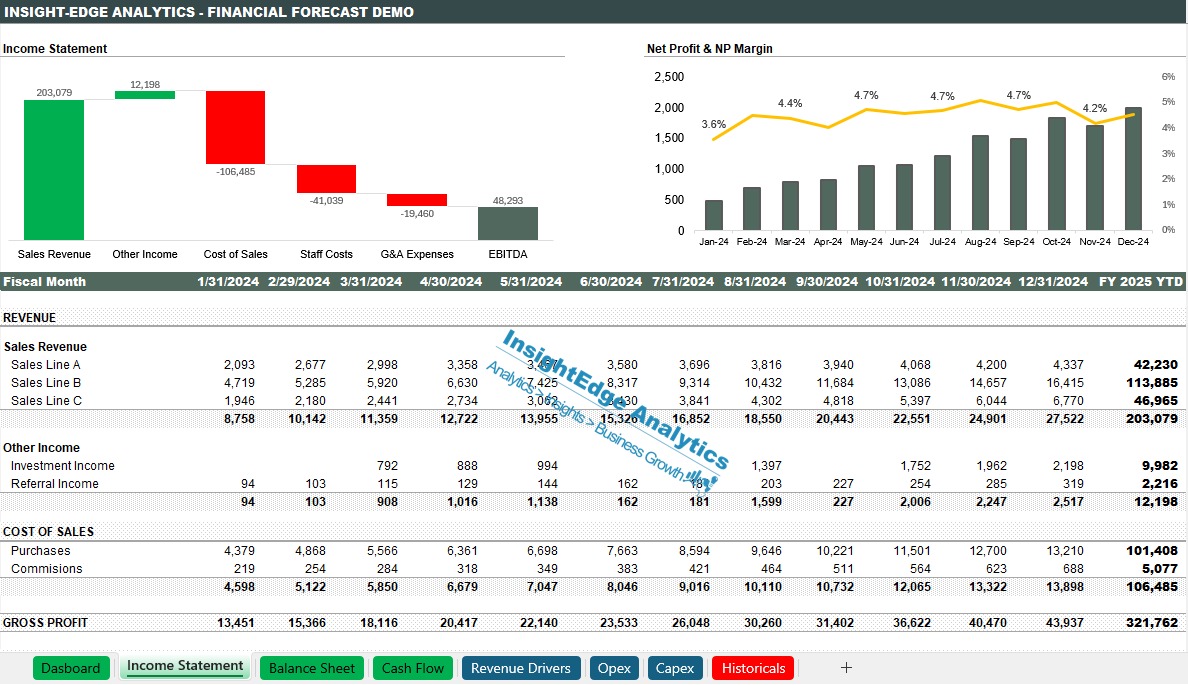
Microsoft Excel Finance Report
This Excel-based finance report offers a clear and organized view of your organization’s financial performance. Designed for ease of use and real-time insights, it tracks key financial metrics such as revenue, expenses, profit margins, and cash flow.
Key features include of our finance reports include monthly and year-to-date (YTD) financial summaries, budget vs. actual comparisons, dynamic charts and pivot tables for visual analysis, built-in data validation, departmental or project-level breakdowns etc.

~ Our Showcase
Customer Analytics:
Customer analytics techniques help your business improve sales, customer experience, conversion rates, personalized marketing, customer retention, and informed decision making
- Recency, Frequency and Monetary (RFM) Analysis
Recency: How recently a customer has made a purchase. Customers who bought recently are more likely to buy again than those who haven’t purchased in a while. Frequency: How often a customer makes a purchase. Customers who purchase frequently are more loyal. Monetary: How much money a customer spends. Customers who spend more are typically more valuable.

Using RFM analysis, businesses can identify different customer segments and target them more effectively with tailored marketing strategies:
- Champions: Recent, frequent, and high-spending customers > Send exclusive offers or loyalty rewards>
- Loyal Customers: Frequent, but less recent customers > Send re-engagement offers or loyalty perks
- Potential Loyalists: Recent and high spenders, but not very frequent > Target with retention campaigns to increase frequency
- At Risk: Customers who used to buy frequently but haven’t purchased in a while > Use reminders/special offers to win them back
- Hibernating: Customers who haven’t bought in a long time, are infrequent, and spent less
2. Other customer analysis techniques include Customer Journey or LTV Analysis and Cohort Analysis
~ Our Showcase
NGO Expenses Tracker Dashboard
This report gives an overview of how financial resources are allocated and utilized across programs, departments, and initiatives within an NGO. It combines real-time data visualization with interactive dashboards to offer stakeholders a clear, transparent, and actionable view of spending patterns.
The report supports accountability, transparency, and data-driven decision-making, ensuring that every dollar spent aligns with the organization’s mission and impact goals.

~ Our Showcase
Excel Bookkeeping and Accounting
This is a Microsoft Excel bookkeeping/ accounting spreadsheet suitable for small to medium retail shops.
Main features / functions include Point of Sale functionality, entering other transactions like purchases, expenses etc., creating invoices and account statements, inventory management, debtors and creditors management, asset register management, client/ partner register management, financial performance dashboard, generating and exporting reports e.g. financial statements (Income Statement and Balance Sheet), inventory report, input and output VAT schedules etc.
At $10 per month, you can have all the functions above, and save on bookkeeping costs, improve efficiency and most importantly track and improve your business financial performance.
Ready to track and manage your small business finances, Contact us today.
~ Our Showcase
Material Requirements Planning, costing and margin analysis
MRP is a digital inventory management and production planning system used to ensure that materials and products are available for manufacturing and delivery on time. It helps businesses calculate what materials are needed, how much is required, and when they should be ordered or produced. Many small-medium manufacturing companies struggle to systematically plan their procurement and ensure efficiency in production and warehousing. InsightEdge helps small-medium manufacturing companies with advanced MRP templates that can help in procurement planning, stock monitoring and stock take reconciliations. Our template also allows easy but efficient product costing, pricing and continuous margin monitoring.
~ Contact Us
Let’s Start the Conversation
Have a question? Want to discuss data analytics, excel spreadsheets, automation solutions or request a demo? We’d love to hear from you.

